
Price Elasticity Isn't Just for Economists: It's One of Your Biggest Margin Levers
Every retailer knows the basic rule: cut a price and you usually sell more; raise it and you usually sell fewer. What decides your profit is how much sales change when a price moves. That has a name: price elasticity of demand.
Why independent retailers find this hard
Large retailers often have pricing teams who estimate how each category responds to price. They might find that a 5% cut on a branded item customers can buy anywhere lifts its sales by around 10%, while the same cut on a signature product customers can only get from them barely moves its sales. That tells them where a price cut might pay for itself and where it simply gives margin away.
For retailers turning over £2m to £50m a year, that kind of analysis has usually been out of reach. Hiring someone to do it is a significant cost, and by the time a manual analysis is finished the season may have moved on. So many owner-operators fall back on two simpler rules: match the competitor down the road, or apply the same percentage markup to everything.
Neither rule looks at how your own customers respond to price, so both can leave money on the table.
What price elasticity actually tells you
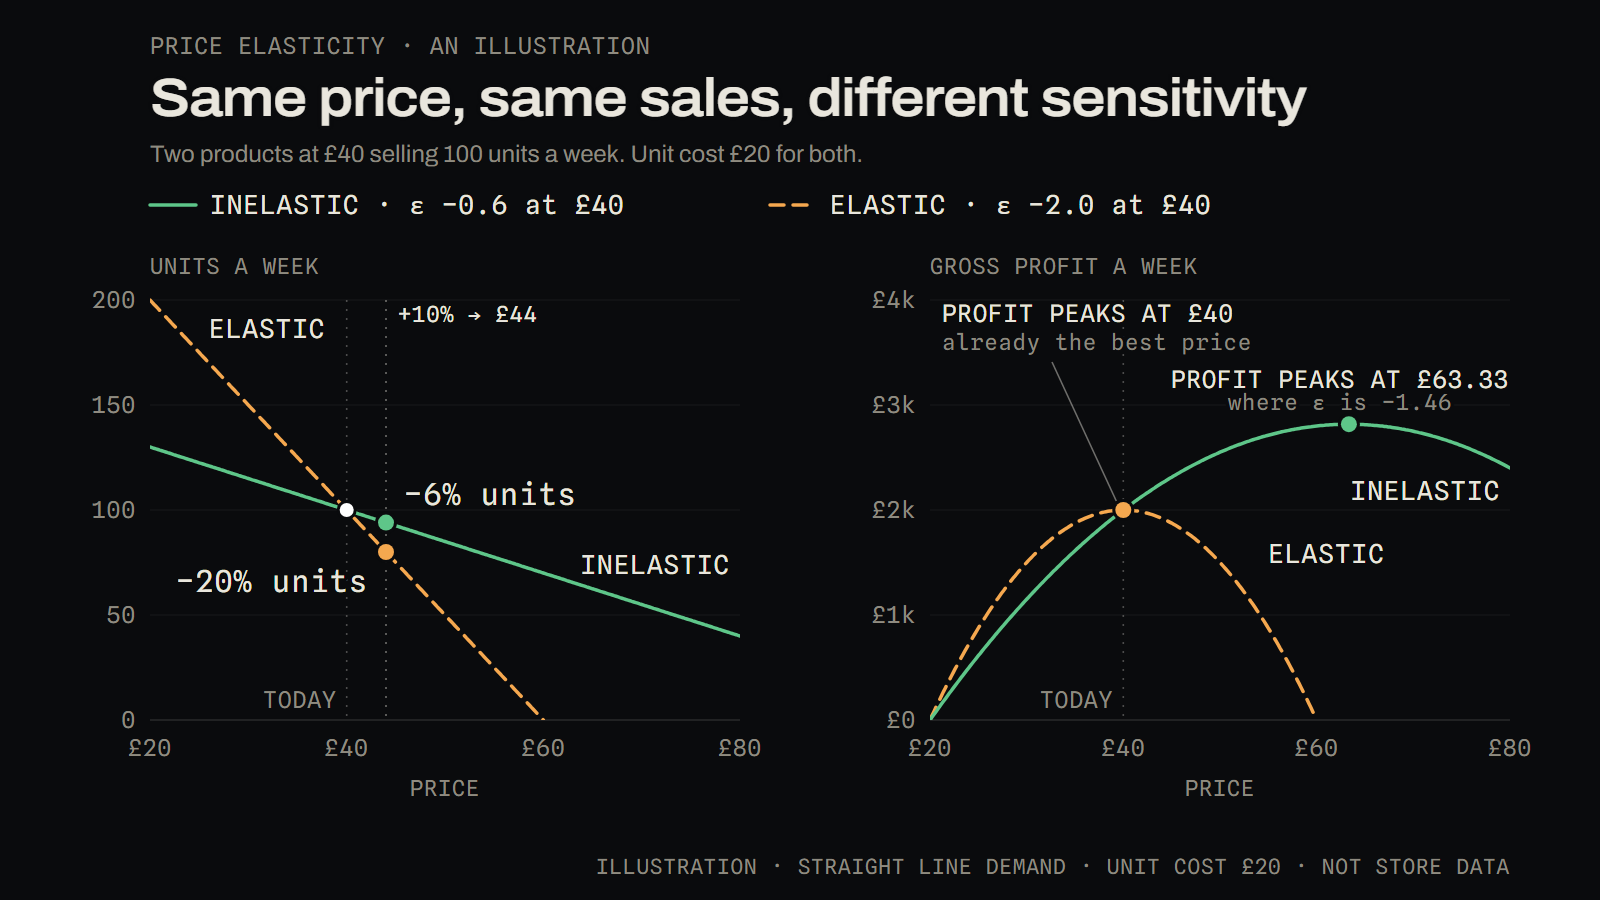
Price elasticity is the percentage change in units sold divided by the percentage change in price. It's almost always negative, because a higher price usually means fewer sales. An elasticity of −2 means a 1% price rise costs about 2% of units; an elasticity of −0.6 means it costs about 0.6%. Products between 0 and −1 are called inelastic, and products below −1 (such as −2) are called elastic.
The chart takes two products that both sell 100 units a week at £40 and cost £20 each. A 10% price rise costs the inelastic product 6% of its units, so its revenue rises by about 3% and its gross profit by about 13%. The same rise costs the elastic product 20% of its units, so its revenue falls by 12% and its gross profit by 4%.
That's the insight: a product that is inelastic at its current price is priced too low, on its own numbers. A price rise brings in more revenue from fewer units, and fewer units cost less to buy, so profit goes up. You do sell a few fewer, but the extra margin more than makes up for them.
It doesn't go on forever. As a price rises, customers usually become more sensitive to it. In the chart, the inelastic product's profit peaks at about £63, where its elasticity has reached about −1.5. Economists call the rule behind this the Lerner condition: at the profit-maximising price, your margin as a share of the price equals 1 divided by the elasticity, ignoring the minus sign. At −2 that's a 50% margin, which is exactly where the elastic product already sits at £40 with a £20 cost. At −4 it would be 25%.
So products with high elasticity need sharper prices because the arithmetic leaves them less room for margin, not because they automatically bring people to your store. Whether a product drives traffic or bigger baskets is a separate question: it depends on whether customers notice its price and what else they buy with it. Cutting the price of one product can also just move sales away from a similar product you sell.
How to start thinking about elasticity today
You don't need a PhD to use this. Here are three things you can do now:
1. Sort your catalogue by how price-sensitive it looks. Your past promotions are a starting point. Which products jumped in sales when discounted, and which barely moved? Treat the answers as rough. A promotion also brings emails, banners and urgency, some customers simply buy earlier than they would have, and the season moves sales too. Compare each promoted product with similar products you didn't promote over the same weeks, and with its own sales before and after.
2. Stop using one markup for everything. By the Lerner condition, a 50% markup on cost (a margin of a third of the price) is only the profit-maximising price for a product with an elasticity of about −3. Products that are less price-sensitive than that can usually carry a higher margin; products that are more price-sensitive need a thinner one.
3. Keep checking. Price elasticity isn't fixed. It shifts with the seasons, trends, what competitors do and how strong your brand is. Customers also tend to react more over months than over days, as they find alternatives, so a product that looks inelastic just after a price rise may not stay that way. And something that was elastic last year might be less so this year because you've built a loyal following.
Where Price Fusion fits
This is where Price Fusion comes in. It estimates how each product's sales respond to price from your own sales history, labels the estimates it's less confident in, and recommends prices within the margin guardrails you set. Nothing changes in your store until you approve it.
Price elasticity isn't just an academic idea. Used well, it helps you grow profit, not only revenue. And in a tough trading environment, profit is what keeps the lights on.